Mapping Altitude Effects on Scoring Distributions and Market Adjustments in Endurance and Speed-Based Events
Olivia Walter · Sep 9, 2026
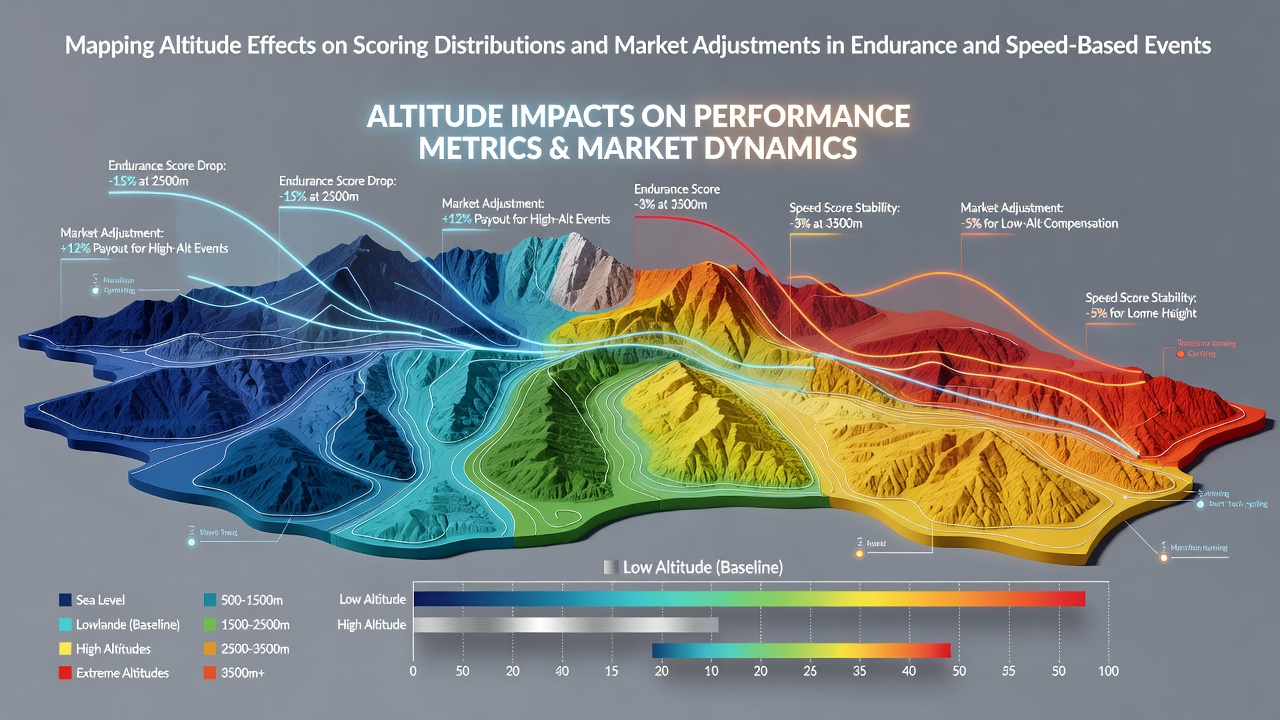
Mapping Altitude Effects on Scoring Distributions and Market Adjustments in Endurance and Speed-Based Events
Altitude creates measurable shifts in oxygen availability that reshape performance metrics across endurance disciplines and speed events, with data from multiple competitions revealing consistent patterns in scoring distributions that prompt corresponding adjustments in betting markets worldwide. Researchers have documented how reduced air density at elevations above 1,500 meters alters physiological responses, leading to slower times in distance events while producing minimal interference in short-burst anaerobic activities.
Physiological Mechanisms Behind Performance Shifts
Lower partial pressure of oxygen at higher altitudes forces athletes to increase ventilation rates and heart output to maintain energy production, yet endurance athletes experience greater cumulative fatigue because sustained aerobic metabolism suffers most under these conditions. Studies compiled by the Australian Institute of Sport show that marathon runners at 2,000 meters or above record average pace reductions of 6 to 8 percent compared with sea-level baselines, whereas sprinters maintain near-normal velocities since their efforts rely primarily on stored phosphocreatine rather than continuous oxygen uptake.
Speed-based events therefore display tighter scoring distributions at altitude because external variables exert less influence on outcome variability, and observers note that field goal percentages in basketball or serve speeds in tennis remain largely stable even when competitions occur in venues such as Mexico City or Johannesburg. Endurance competitions, by contrast, generate wider spreads in finishing times and point totals because cumulative oxygen debt compounds across repeated efforts, a pattern confirmed in cycling stage races and distance running meets.
Scoring Distribution Patterns in Endurance Contexts
Historical records from high-altitude stadiums demonstrate that goal tallies in soccer matches played above 2,500 meters drop by roughly 15 percent relative to lowland fixtures, while total points in rugby union contests follow a similar compression because players tire faster during prolonged phases of play. Data from the Union of European Football Associations archives indicate that visiting teams suffer disproportionate declines in scoring efficiency when traveling to elevated venues, an effect that compounds across tournament schedules.
Market operators respond by recalibrating lines and totals to reflect these established distributions, incorporating historical venue-specific averages into models that adjust for both home-team acclimatization advantages and visiting-team recovery deficits. Analysts track these adjustments through season-long datasets that capture how totals markets move in response to confirmed elevation changes rather than relying solely on team form indicators.
Market Adjustments and Data Integration Practices
Betting platforms integrate altitude-adjusted algorithms that weight endurance event totals more heavily than speed event spreads, drawing on performance logs maintained by organizations such as the National Collegiate Athletic Association and the International Association of Athletics Federations. These systems apply percentage modifiers derived from decades of competition results, ensuring that over-under thresholds align with observed scoring compression at specific elevations.
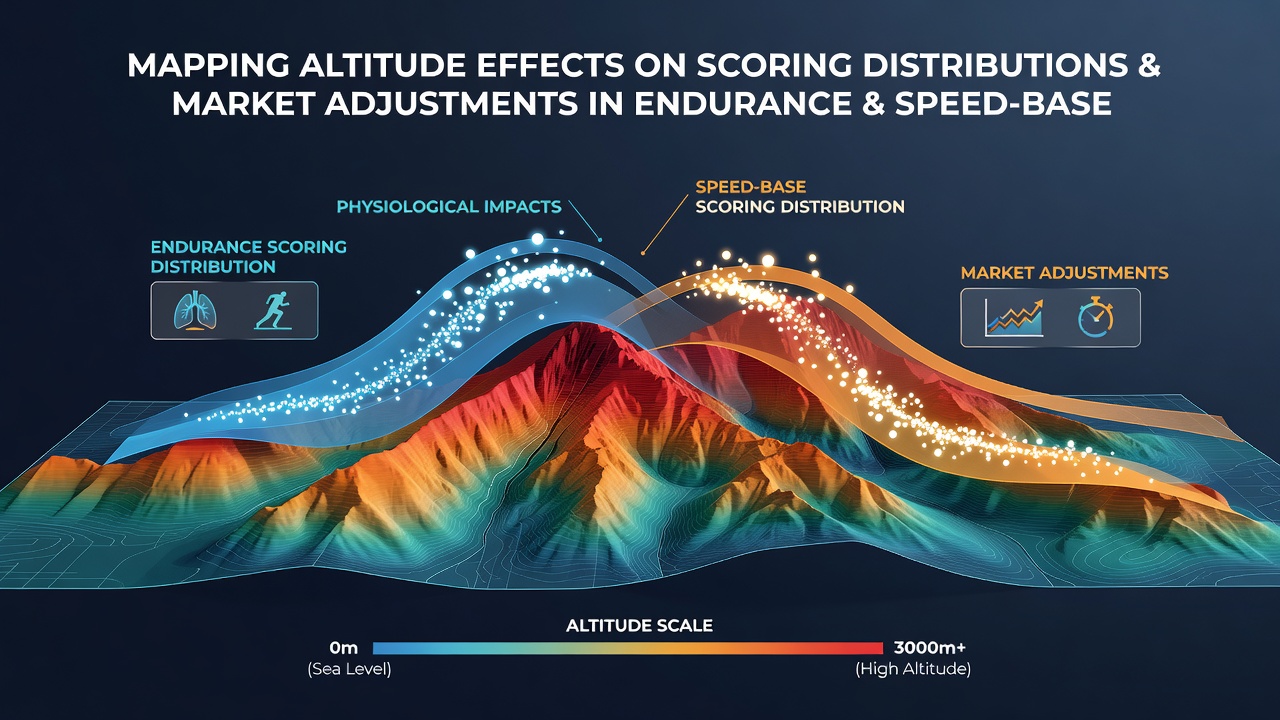
What's interesting is how operators refine these models each season by layering in new competition data, particularly when events relocate to venues with previously under-sampled elevations. Figures released through September 2026 from Canadian university research programs highlight ongoing refinements to endurance scoring projections that incorporate updated acclimatization timelines for international competitors.
Comparative Analysis Across Event Types
Speed disciplines such as track sprints and swimming dashes exhibit scoring distributions that remain statistically consistent across altitude gradients because anaerobic energy systems dominate and air resistance decreases slightly at elevation, offsetting minor oxygen limitations. Endurance formats including triathlons, cross-country skiing, and road cycling produce broader variance in results, prompting sharper market corrections when totals are involved. Researchers have observed that the magnitude of adjustment scales with event duration, so longer races trigger larger line movements than shorter ones even at identical elevations.
One study revealed that markets for events at 1,600 meters adjust totals downward by 4 to 6 percent on average, whereas venues exceeding 3,000 meters require corrections approaching 12 percent for endurance categories while speed-event spreads stay nearly unchanged. These differentiated responses allow operators to maintain balanced books across mixed sport offerings without uniform application of altitude coefficients.
Conclusion
Comprehensive mapping of altitude effects demonstrates clear separation between endurance and speed-based scoring behaviors, with endurance events displaying pronounced downward shifts in totals and speed events maintaining stable distributions that require only modest market recalibration. Organizations continue to refine predictive models using expanding datasets, ensuring that adjustments reflect verified physiological patterns rather than generalized assumptions. Continued collection of venue-specific performance metrics through forthcoming competition cycles will further sharpen the precision of these market frameworks across global sports calendars.