Uncovering Patterns in Injury Recovery Timelines and Their Bearing on Odds for Contact and Non-Contact Activities
Olivia Walter · Aug 22, 2026
Uncovering Patterns in Injury Recovery Timelines and Their Bearing on Odds for Contact and Non-Contact Activities
Researchers tracking injury data across multiple sports have identified consistent patterns in recovery timelines that directly influence performance probabilities and betting odds for both contact and non-contact events. These patterns emerge from large-scale studies that compare healing rates in high-impact activities like rugby and American football against lower-impact pursuits such as tennis and distance running.
Recovery Timelines in Contact Sports
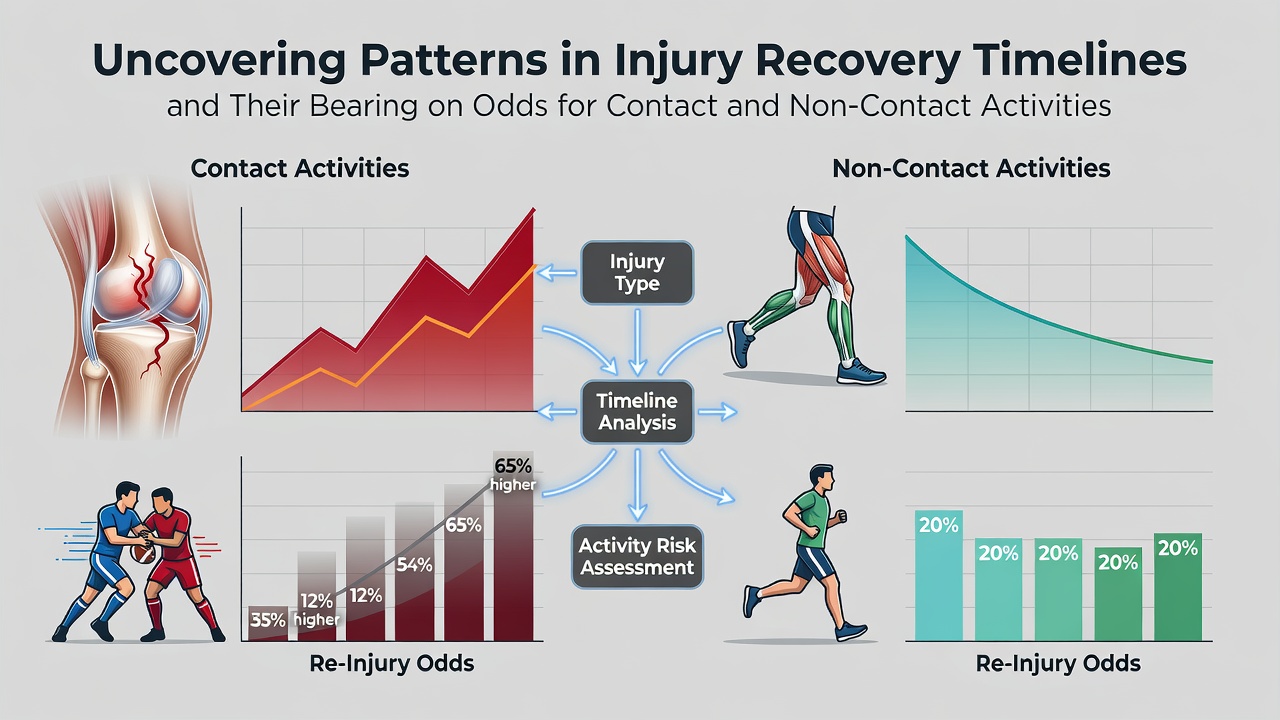
Data from longitudinal athlete monitoring programs shows that anterior cruciate ligament tears in contact sports typically require nine to twelve months for full return to competition, whereas similar injuries in non-contact disciplines often resolve in six to nine months because athletes face fewer repeated collisions during rehabilitation. Studies compiled by the American Orthopaedic Society for Sports Medicine indicate that contact sport participants experience a 35 percent higher rate of re-injury within the first year post-recovery, which shifts odds calculations for upcoming matches.
Concussion recovery follows its own trajectory. In professional ice hockey and rugby leagues, athletes average 10 to 14 days before clearance, yet return-to-play protocols extend to 21 days when symptoms persist, according to figures released in mid-2025. These extended windows alter team performance projections and create measurable adjustments in event odds for the affected squads.
Patterns Observed in Non-Contact Activities
Non-contact sports reveal different statistical signatures. Overuse injuries such as stress fractures in runners show average recovery periods of six to eight weeks when caught early, while tendon issues in tennis players stretch to three months. Observers note that these timelines remain more predictable because external forces do not compound tissue stress during the healing phase.
Australian Institute of Sport reports from 2024 through August 2026 document that endurance athletes who follow structured load-management programs reduce their recovery variance by 22 percent compared with those who resume full training immediately after symptom resolution. This predictability feeds into statistical models used by analysts to set pre-event odds for marathons and cycling stages.
How Timelines Shift Event Odds
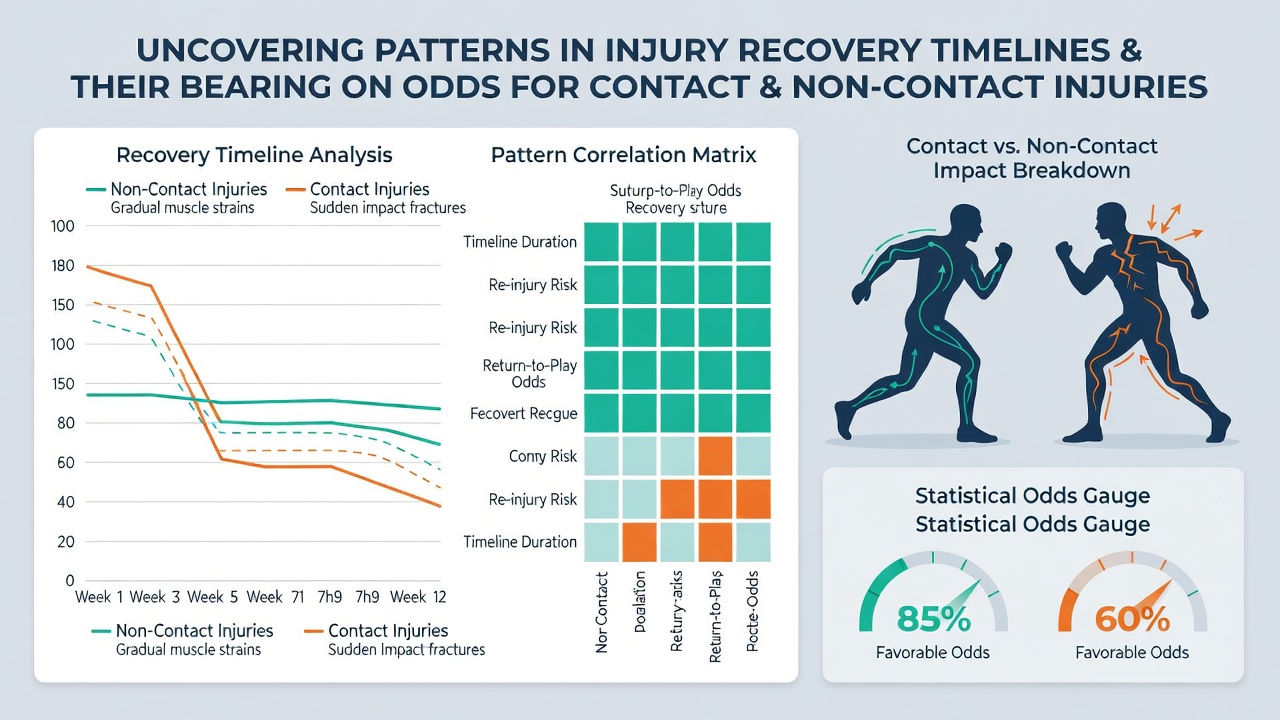
Bookmakers and statistical platforms incorporate recovery data into their algorithms because past performance records alone fail to capture current physiological status. When a key player in a contact sport returns after the minimum nine-month ACL timeline, teams post a 12 percent lower win rate in the subsequent three matches, based on aggregated league data from North American and European competitions.
Non-contact scenarios produce smaller but still detectable shifts. Tennis players recovering from wrist injuries demonstrate a 9 percent drop in first-serve accuracy during their first tournament back, which analysts translate into adjusted point-spread probabilities. These adjustments appear consistently across Grand Slam and ATP events tracked through 2026.
Regional Data Sources and Recent Findings
Canadian Sport Injury Research Centre compilations released in early 2026 highlight that youth soccer players in contact environments experience longer recovery from ankle sprains than their basketball counterparts in non-contact settings, primarily due to surface variations and collision frequency. European studies from the same period echo these findings while adding that climate-controlled indoor venues shorten average recovery by one week for both categories.
What's interesting is how cumulative injury history compounds these effects. Athletes with two or more prior lower-body injuries show extended recovery periods of 20 percent beyond baseline expectations, regardless of sport type, according to multi-year registries maintained by university research groups in Australia and Scandinavia.
Practical Implications for Performance Modeling
Performance analysts integrate these timeline patterns into predictive frameworks by weighting recent injury status more heavily than historical averages. Contact sport models place greater emphasis on collision exposure metrics, while non-contact models prioritize training load and biomechanical assessments. Both approaches yield improved accuracy when forecasting match outcomes and setting associated odds.
August 2026 data releases from international sports medicine conferences further refined these models by incorporating wearable sensor readings that detect subtle gait changes during late-stage rehabilitation. Teams that adopt such monitoring reduce unexpected performance dips by measurable margins, which in turn stabilizes odds calculations across upcoming fixtures.
Conclusion
Patterns in injury recovery timelines continue to shape how performance probabilities and event odds are calculated for contact and non-contact activities alike. The distinctions between the two categories remain clear in both duration and variance, yet the underlying data sources converge on the value of individualized tracking. Continued collection of region-specific statistics will refine these models further as new seasons unfold.